The Bumpy Road to Normal
Quarterly NewsletterBy Dr. Robert Votruba
Higher for longer. Over the past several weeks, those three words have spooked the stock and bond markets. The phrase refers to interest rates, and the Federal Reserve’s most recent projection is that today’s seemingly high interest rates might last longer than they and most of the world had previously anticipated. The Fed hinted towards the “neutral rate” (an invisible Goldilocks-like interest rate that keeps the economy growing but inflation under control) having to be higher than recently thought. Higher interest rates make borrowing more expensive for consumers and businesses. Thus, the fear is that the economy might eventually encounter the recession that economists have been waiting for over a year.
It seems that determining if something is “high” or “low” is easy to do if it can be measured with precision like interest rates are. Someone who measures 7 feet in height is tall. Summers in the Arizona desert are hot, where temperatures frequently hit 100+ degrees. But even though interest rates can be measured accurately, determining if they are high might not be so easy.
In a relative sense, both long and short-term interest rates are at a 16-year high. While the Federal Reserve sets the Federal Funds rate (which impacts short-term interest rates), the 10-year U.S. Treasury bond is the heavy hitter when it comes to things that most consumers care about. The “10-year” is to bonds what the S&P 500 and Dow Jones Industrial Average are to stocks – the benchmark. And, unlike the Federal Funds rate, the rate on the 10-year is controlled by market forces, not the Fed. The rate on the 10-year drives many consumer lending rates like home mortgages, which are now at 20-year highs.
Today, the interest rate on a 10-year bond hovers near 4.5%. Interestingly, that is slightly below its average over the past 60 years. Of course, that six-decade time frame encompasses the early and mid-1980s when its yield soared to over 15% (mortgage rates hit 18.6% in 1981) and the most recent near zero percent interest rate era that began in 2008 and ended in 2022. The furthest we can look back is 1790 (credit to Jim Reid of Deutsche Bank for gathering data that goes back to the Washington administration). What is the average interest since then? 4.5%.
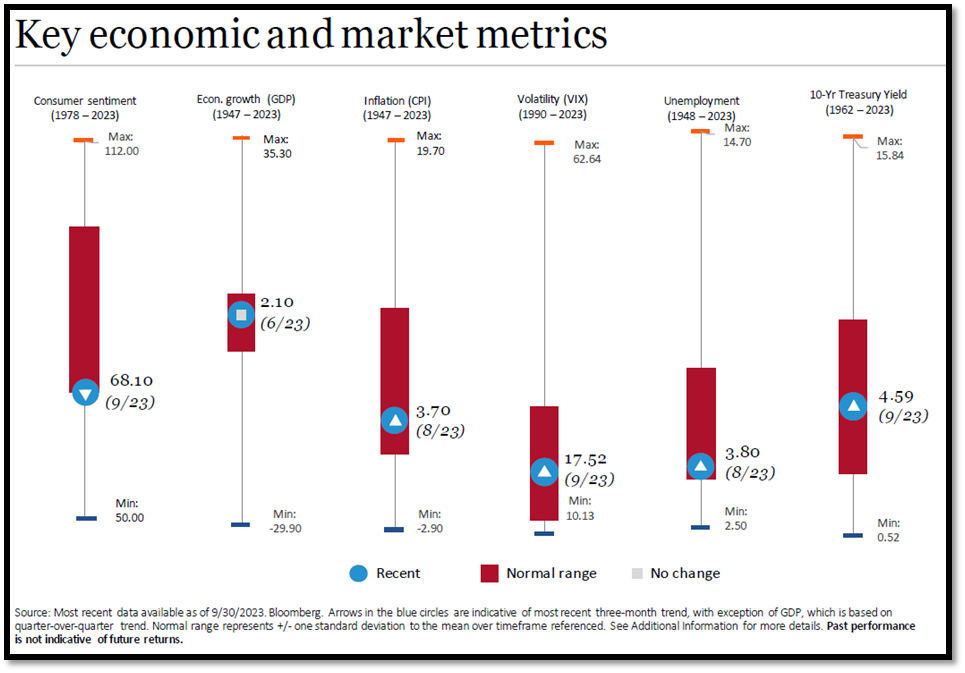
As the economic distortions created by Covid continue to fade, we find that many key economic metrics have gravitated back toward their historical averages. The following chart illustrates such. The image shows six major economic measures, their historical highs and lows, and the normal range. The blue circle is where we are today. Breaking it down, we see the following:
- Interest rates squarely in normal territory.
- A strong job market (unemployment still hovers near 50-year lows).
- Market volatility falling.
- Inflation declining and back within historical norms.
- GDP, the broadest measure of economic growth, at reasonable levels.
- Consumer sentiment near the lower range of normal. Note: a low reading here has usually meant future gains for stocks.
So, if interest rates have simply returned to their long-term average, why all the fuss? Some of the angst is driven by recency bias. For the better part of the last 16 years, interest rates have been near zero. Rates were even lower in Europe, where they were unfathomably negative for a while. Consumers loved this (mortgage rates were less than 3%), as did businesses and the world’s largest borrower – the U.S. government. While cheap borrowing felt good, it distorted markets and couldn’t last forever. Eventually, we must return to normal, which admittingly is a moving target. But the road to normalcy is almost always as bumpy and unpredictable as the roads that bring us off course.
The journey on the road to normalcy began in 2022. This is when inflation peaked (9.1% in June 2022), the Fed began a series of 11 rate hikes, the stock market pulled back nearly 20%, and the bond market had its worst year ever. At the close of 2022, a record percentage of economists called for a recession in 2023, only to be caught off guard by a U.S. economy that has defied expectations – to the upside. In the face of rising rates, which are supposed to cool things off, economic growth, while not spectacular, has been sustained, as the job market remains as strong as it has been since the late 1960’s. After a solid start to 2023 for both stocks and bonds, this stubbornly persistent strength (sometimes good news is bad news) caused long-term rates to rise and dashed hopes for rate cuts that were anticipated to begin in early to mid-2024. This news has recently hurt both stocks and bonds, even if inflationary pressures (the primary determinant in the 2022 sell-off) have eased considerably.
While another increase in interest rates remains uncertain, asserting that the Fed is near the last chapter of this rate hike campaign is a reasonably safe bet. Historically, this has been good news for investors. While cash equivalents like money markets and Treasury Bills are an attractive option today, future returns have been better for those with their cash deployed elsewhere over the 12 months following a final Fed hike, as depicted in this chart.

Financial markets have a history of humbling even the brightest minds. Yes, making predictions is hard, especially about the future. Yet, even explaining market movements with 20/20 hindsight is often tricky. Markets can’t talk, so we try to assign seemingly rational explanations to past movements. Were markets down in September because of rising long-term interest rates? Or was it just the “September effect” (historically, September has been the worst month for the market)? Determining the actual cause is impossible. So, why do so many try if people can’t explain the past accurately or predict the future? Perhaps it's because seeing account values fall is uncomfortable. Psychologists have a label for this – loss aversion. Loss aversion is the phenomenon where loss is perceived as more emotionally severe than a gain. The joy of making money does not offset the emotional pain of losing it, even if the actual dollars earned exceed those lost.
Over short-term periods, losses are not uncommon, even though long-term results might be attractive. The following chart illustrates this concept nicely and shows contrasting perspectives of an investment in the S&P 500. The short-term view is one that many investors have of their portfolios – monthly returns (these days, looking at daily values is likely even more common). The long-term view plots the same investment over the same period but shows the annual change in the portfolio value invested instead. With this perspective, the short-term fluctuations of the first chart have smoothed out over time, and the picture of a growing portfolio becomes clearer.
We can’t say where interest rates will settle because they are a moving target. Interest rates move in response to economic conditions, which are constantly changing (one could also argue that economic conditions change in response to moving interest rates). Either way, like stock prices, interest rates never sit still. However, for the first time for the better part of the past 16 years, there is a cost of money – and this is necessary for capital markets to exist over the long term. Lenders (bond holders are lenders) are finally being rewarded with real interest payments. Businesses must borrow more thoughtfully, and so too must consumers. Riskier endeavors are likely to attract fewer dollars because investors can finally earn a rate of return on safer options. Simply put, the relationship between risk and reward that anchors most investment decisions is gradually becoming normalized.
While financial markets have rewarded long-term investors throughout history, they have punished those who try to “time the market.” For instance, a long-term investor who becomes nervous due to geopolitical events and moves to short-term instruments (like CDs or money markets) is considered a “market timer.” To deter this behavior, the market (the S&P 500 in this example) offers a disproportionate share of returns on only a few select days. Nobody knows when these days will occur, and to make matters worse, these days usually occur during times when it feels safest to time the market – during turmoil.
The most recent 20-year period ending on December 30, 2022, provides an excellent example. There were plenty of bumps along the way during that time frame, including COVID-19, a contentious political environment, war, and inflation spiking to 40-year highs. Yet still, a $100,000 investment in the S&P 500 grew to $648,440 under a buy-and-hold strategy. Had 10 of the best days in the market been missed during that time frame – only one day every other year – over $350,000 of growth was lost. So, the same $100,000 grew to $297,080 rather than nearly $650,000. Had the best 20 days been missed (1 day a year), only $78,260 of growth was realized. And, if the 40 best days were missed (only 2 days a year), the investor experienced a loss. The trickiest part is that seven of the best 10 days occurred within two weeks of the 10 worst days. We hope this knowledge provides comfort when we hit the next bump in the road.
Registered Representative and Financial Advisor of Park Avenue Securities LLC (PAS). Securities products and advisory services offered through PAS, member FINRA, SIPC. Financial Representative of The Guardian Life Insurance Company of America® (Guardian), New York, NY. PAS is a wholly owned subsidiary of Guardian. National Financial Network is not an affiliate or subsidiary of PAS or
Guardian. CA Insurance License Number - 0D23495. Data and rates used were indicative of market conditions as of the date shown. Opinions, estimates, forecasts and statements of financial market trends are based on current market conditions and are subject to change without notice. References to specific securities, asset classes and financial markets are for illustrative purposes only and do not constitute a solicitation, offer, or recommendation to purchase or sell a security. Past performance is not a guarantee of future results. S&P 500 Index is a market index generally considered representative of the stock market as a whole.Exp:10/13/2025